developer.datasetSchemes
From autoplot.org
Purpose: Enumerate QDataSet data schemes, or types of data, and show example renderings in Autoplot.
Audience: Developers and users wanting an overview of what Autoplot can display.
Note, this page is broken because many of the dataset URIs no longer work. TODO: point test140 at this page...
Keywords: plot types, schemes
Contents |
1. Introduction
QDataSet is the data representation model used within Autoplot. It was first implemented in IDL in the software PaPCo, and has evolved quite a bit since then. Previous data models we would use required revisiting the code and constantly modifying the library to add new data types. It uses a thin syntax and rich semantics to model many types of data, and typically new types of data can be modeled without modifying the library.
Since there's no table of Java types, this document serves to name and enumerate the types which have been used. Also, the Java code within QDataSet org.das2.qds.examples.Schemes will generate all types, as well as a method for testing if a dataset is of the given type.
2. Rank 1 Time Series
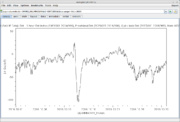
Scalar quantity, such as density, is a function of an independent parameter like time.
2.1. Examples
- DST[Time] vap+cdaweb:ds=OMNI2_H0_MRG1HR&id=DST1800&timerange=Oct+2016
3. Rank 2 Spectrogram
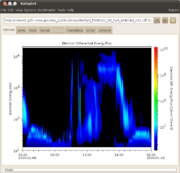
Simple table of values which are a function of X and Y, such as Flux(Time,Energy)
3.1. Examples
- Flux[Epoch,Energy] http://cdaweb.gsfc.nasa.gov/istp_public/data/polar/hyd_h0/$Y/po_h0_hyd_$Y$m$d_v01.cdf?ELECTRON_DIFFERENTIAL_ENERGY_FLUX&timerange=20000109
4. Rank 3 Join of Spectrograms
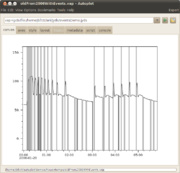
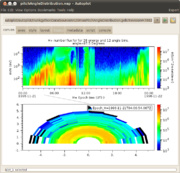
Array of spectrograms, each containing different Y-tags. Plasma Wave Group at Iowa uses these often.
- vap+d2s:http://www-pw.physics.uiowa.edu/~jbf/data.backup/examples/das2stream/multiModeCassini.ascii.d2s
- vap+qds:http://www-pw.physics.uiowa.edu/~jbf/data.backup/examples/das2stream/waves_srv_2011_221T16_test.qds
5. Events List
Intervals in time, showing when events occurred. This can contain:
- startTime, endTime
- startTime, endTime, plus event description (event is nominal data)
- startTime, endTime, RGB color, and event description.
Rank 2 bundle dataset with the last dataset (description) an ordinal unit. Here are examples:
http://autoplot.org/autoplot/data/event/simpleEvent.txt http://autoplot.org/autoplot/data/event/events.dat
6. Image
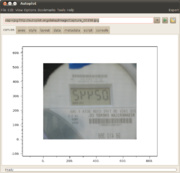
Image, for example from a JPEG file.
6.1. Examples
- Image[705,528,DEPEND_2=3] 'http://autoplot.org/data/image/Capture_00158.jpg'
7. Pitch Angle Distribution
Rank 2 dataset with one dimension representing angle and the other radial distance. The angle dimension will be a dependence upon a dataset with either radians for units, or UNITS=Units.degrees. Note either dimension can be the angle dimension, the renderer will resolve this. TODO: introduce a strict version of this with the first dimension the angle dimension, along with a function to make loose ones strict.
7.1. Examples
- Flux[Pitch,Speed]
- vap+jyds:https://github.com/autoplot/app/blob/master/JythonDataSource/src/pitchAngleDistribution.jyds
- This needs work, you have to slice it first, then set the renderType: vap+jyds:https://github.com/autoplot/app/blob/master/JythonDataSource/src/timasPitchAngleDistribution.jyds
8. XYZ Scatter
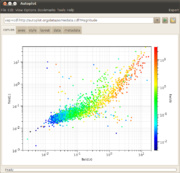
Autoplot's "color scatter" can be used to display xyz triples.
9. Rank 0 Datum (Digital)
Dataset with no indexes, just properties like UNITS and VALID_MIN. For example the time "2011-12-28T00:01" can be represented as a rank 0 dataset, as can "5 Kg".
10. Rank 1 DatumRange (Digital)
Rank 1 dataset with two elements, the property "BIN_0=min,max", and other properties like "UNITS"
11. Waveforms
The Plasma Wave Group at Iowa produces waveform data where it is impractical to timetag each measurement. Further, often the position of each measurement to others is known very precisely, but the position of the group is not. Therefore, waveform packets were introduced. This is a rank 2 dataset, where the ytags are in offset units from the xtags, typically times. When rendered, the data is displayed as though it were rank 1 and there is a timetag associated with each measurement.
vap+inline:ripplesWaveformTimeSeries(10)
This has evolved somewhat, where the DEPEND_1 can be a rank 2 dataset, so that each measurement can be located precisely with a floats, and also where a rank 3 join of rank 2 waveform datasets is supported.
12. Orbit Plots
Timetags along a trajectory. There's no data scheme that triggers Autoplot to use this form, but it can be:
yy[xx[tt]] where yy xx and tt are all rank 1
bundle[i;t,x,y]
13. Complex Data
The Ops.fft function returns ds[n,2], where ds[:,0] are the real components and ds[:,1] are the complex components. The property QDataSet.COORDINATE_FRAME will have the value "ComplexNumber".
