File list
From autoplot.org
| Name | User | Size | Description | |
|---|---|---|---|---|
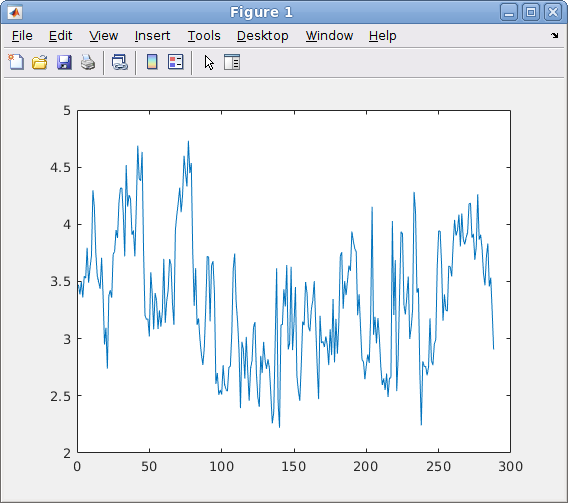
| 18:17, 1 November 2019 | matlabInterface.png (file) | Jbfaden | 27 KB | (Autoplot is used to load data into Matlab.) |
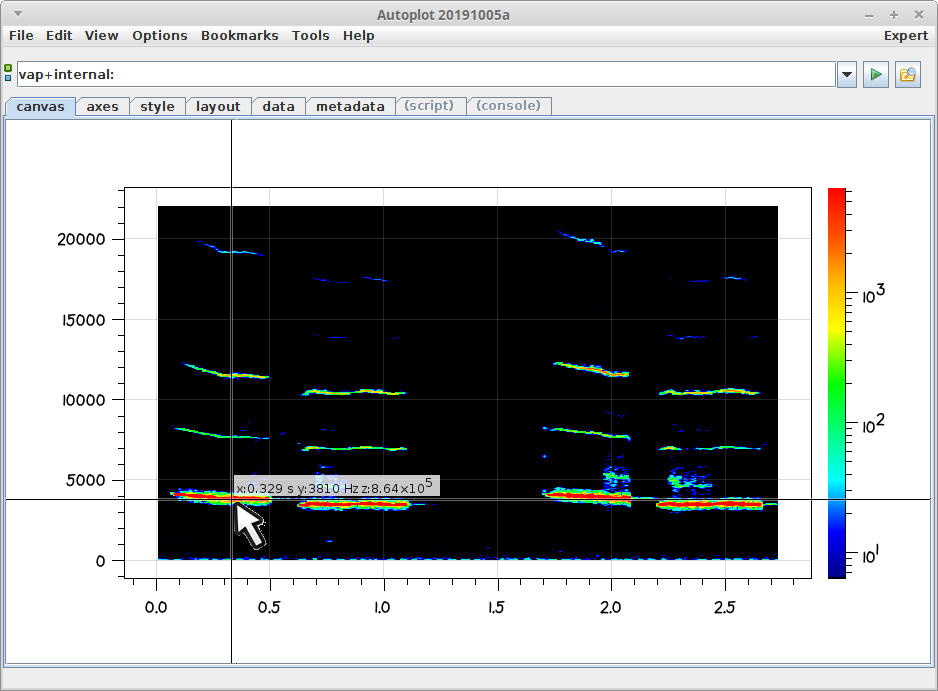
| 14:59, 11 October 2019 | chickadeeSpectrogram.jpg (file) | Jbfaden | 46 KB | (image result from fftPower routine. Note the units of y are "Hz" ) |
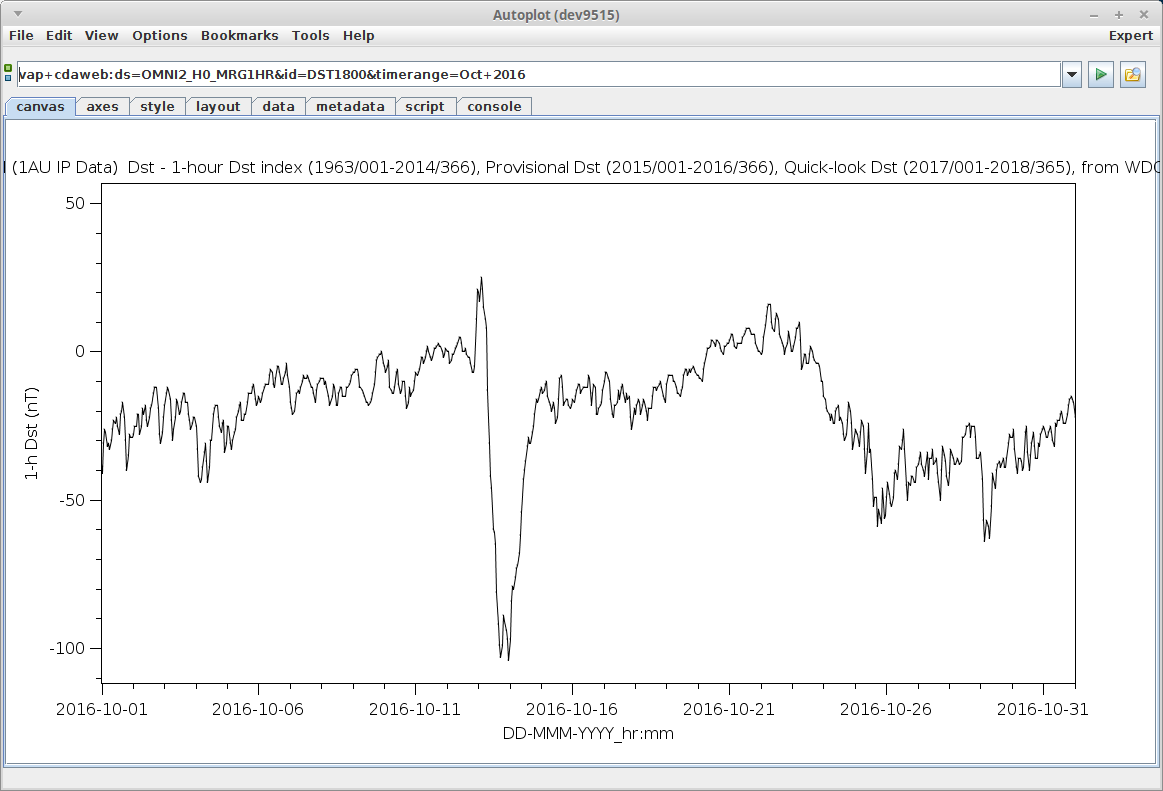
| 15:42, 20 February 2019 | TimeSeries20190220.jpg (file) | Jbfaden | 49 KB | |
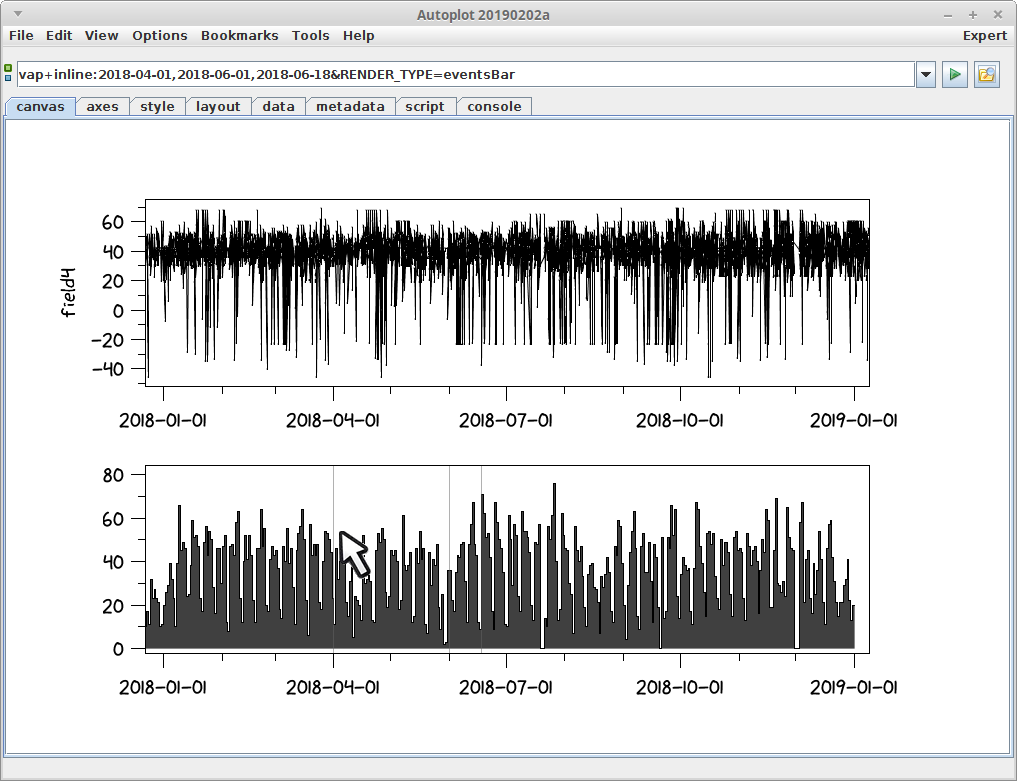
| 14:09, 3 February 2019 | vap_inline_events.jpg (file) | Jbfaden | 58 KB | (Three events are marked in the bottom plot.) |
| 14:07, 3 February 2019 | vap+inline+events.jpg (file) | Jbfaden | 58 KB | (Bottom panel shows events bar with three events.) |
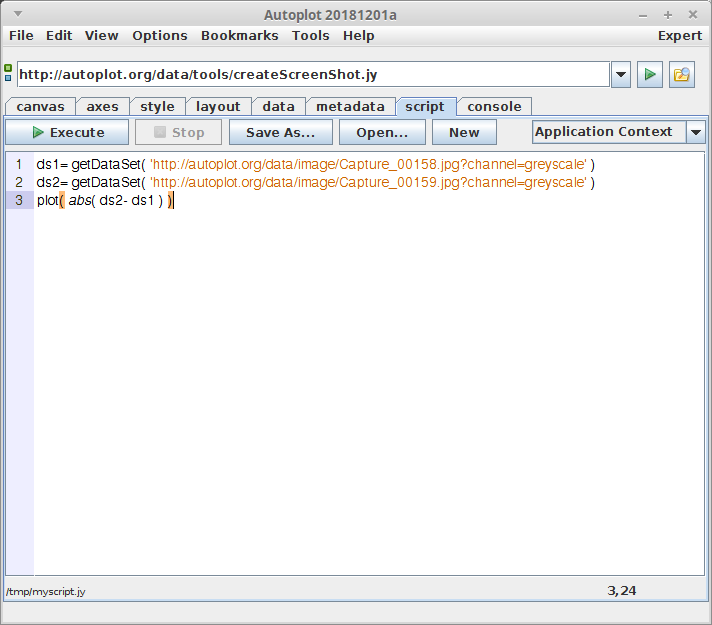
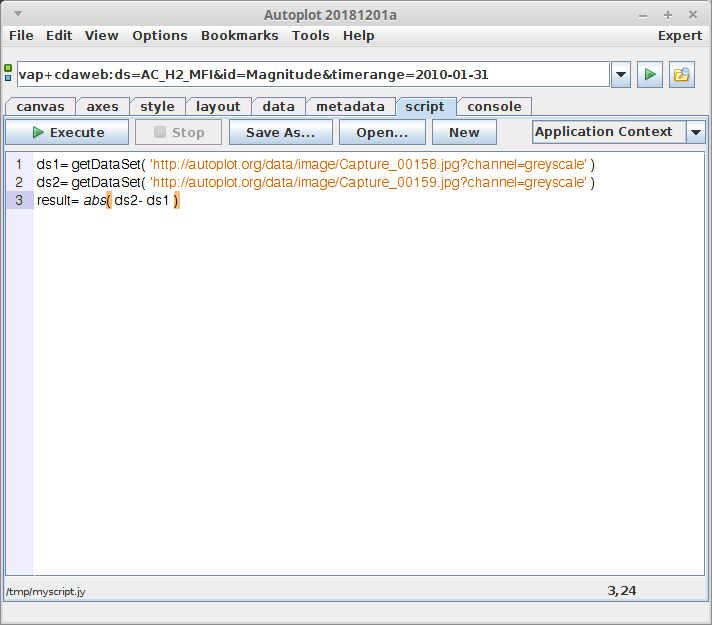
| 14:21, 4 December 2018 | ScriptEditor.jpg (file) | Jbfaden | 18 KB | |
| 14:19, 4 December 2018 | 20181204_141651.png (file) | Jbfaden | 19 KB | (First look at the script editor.) |
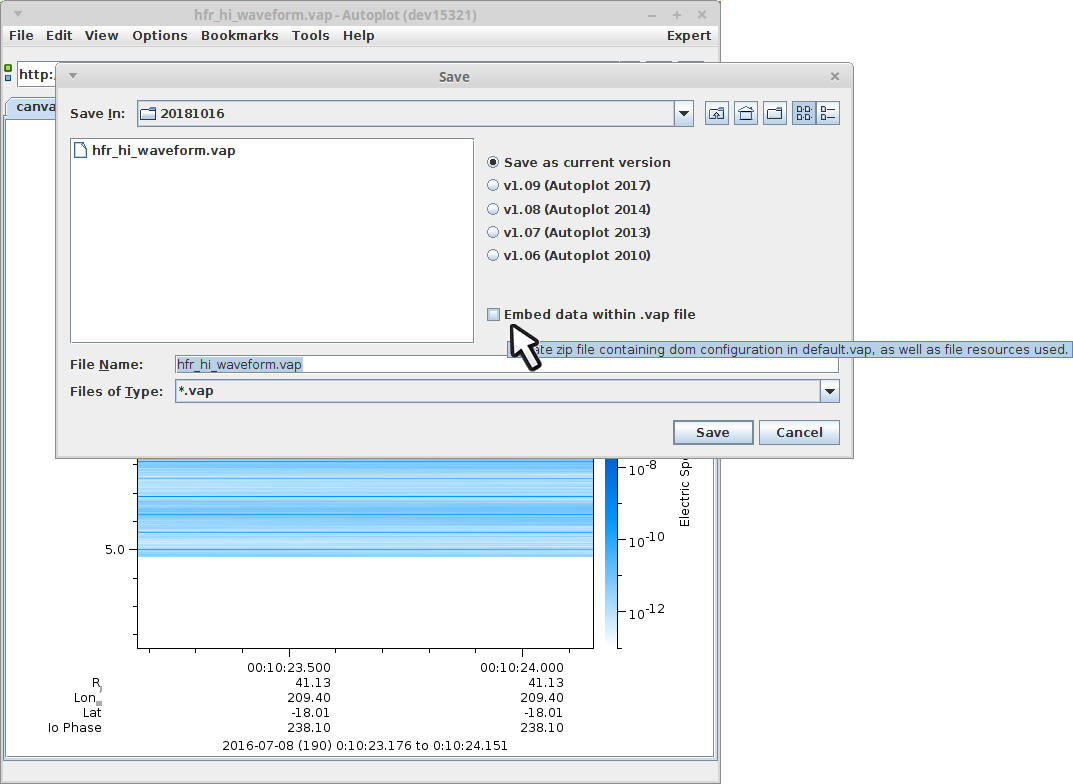
| 10:20, 22 October 2018 | saveVapEmbed.png (file) | Jbfaden | 33 KB | |
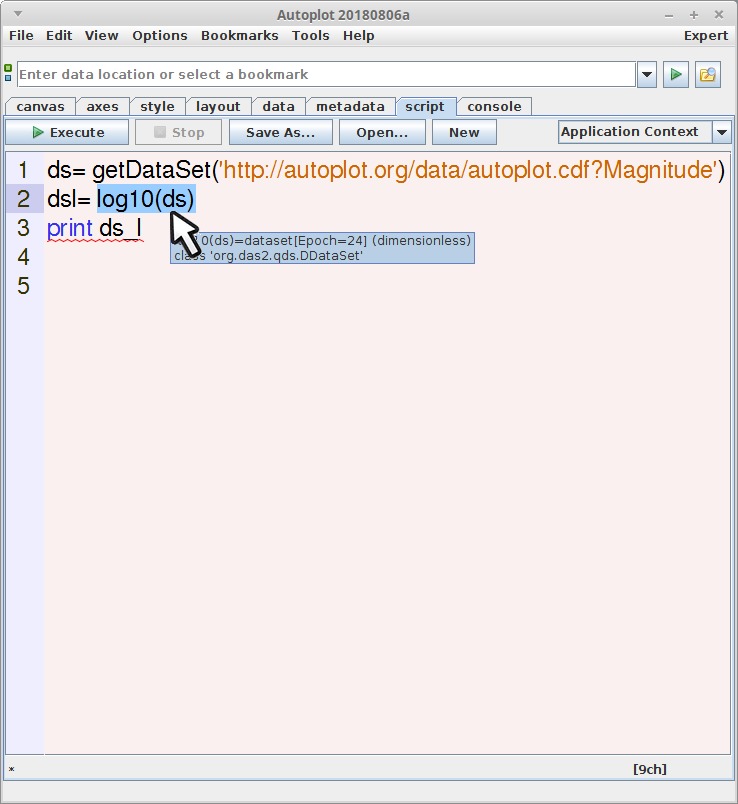
| 16:25, 8 August 2018 | jythonScriptHoverLookup.jpg (file) | Jbfaden | 71 KB | (Tooltips when hovering show highlited expression.) |
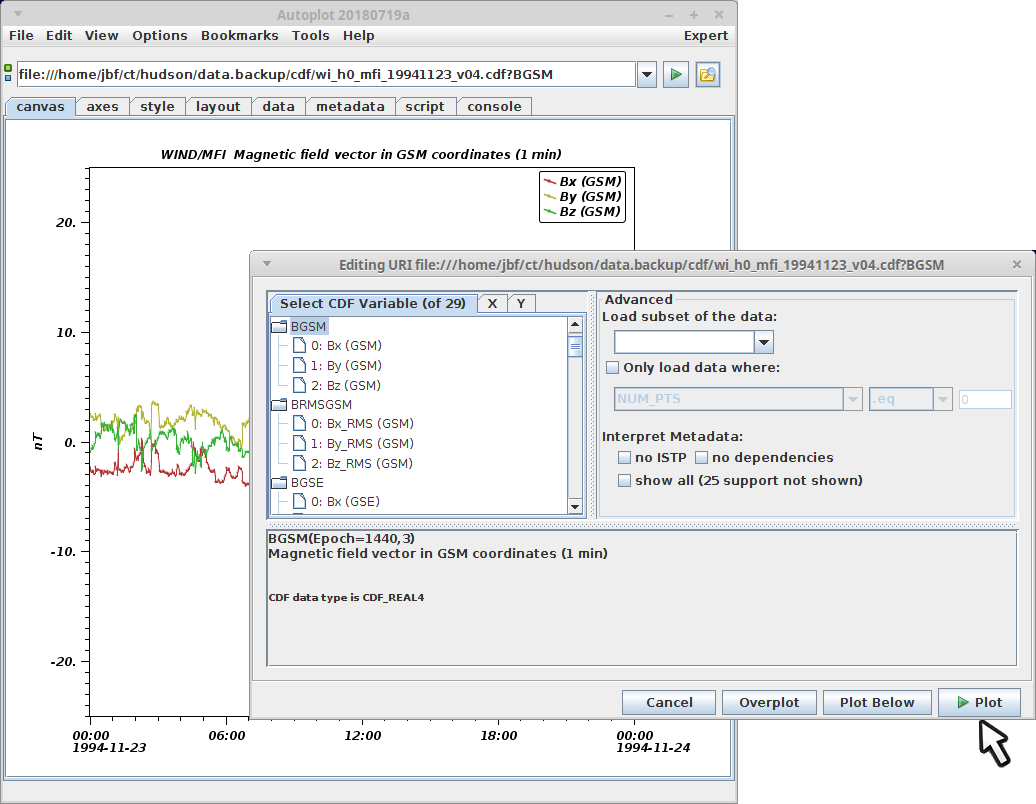
| 13:50, 26 July 2018 | apds.cdf.jpg (file) | Jbfaden | 55 KB | (Data Source Editor for CDF Files) |
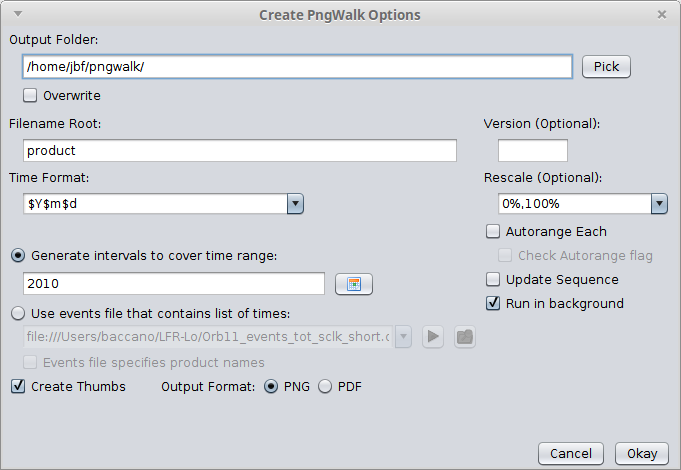
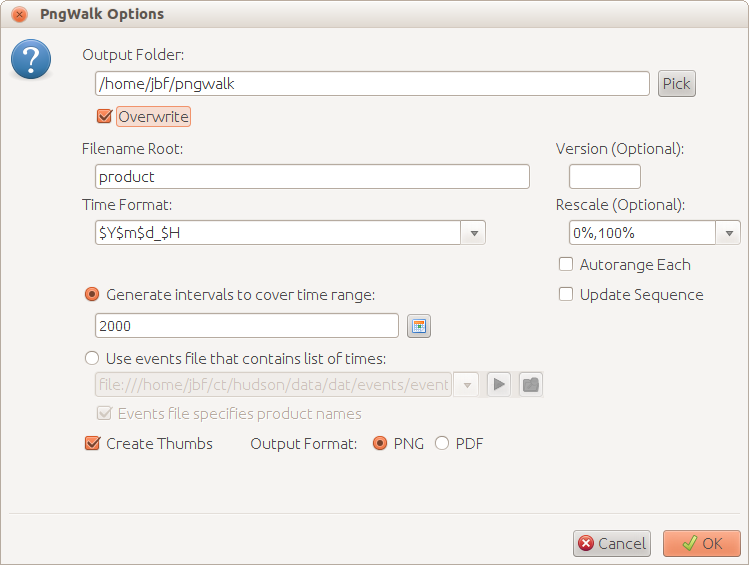
| 11:37, 25 July 2018 | createPngWalk2018.jpg (file) | Jbfaden | 22 KB | (The Create PngWalk GUI.) |
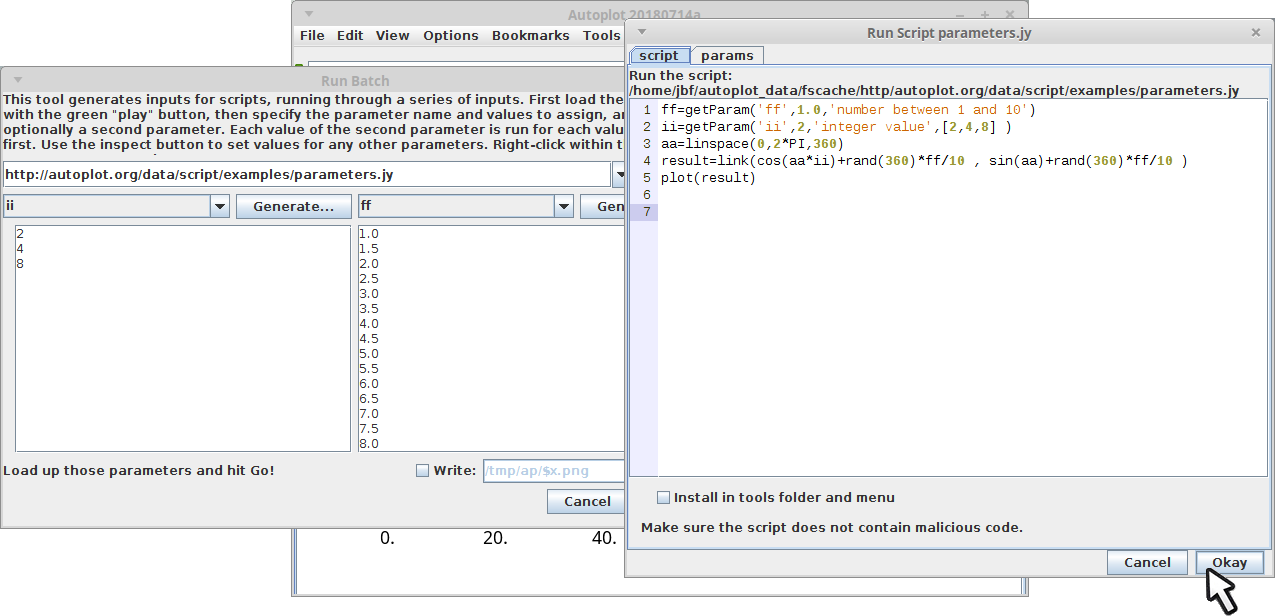
| 12:04, 18 July 2018 | RunBatch.jpg (file) | Jbfaden | 35 KB | (the Run Batch tool generates inputs for a script.) |
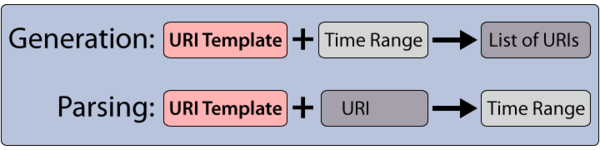
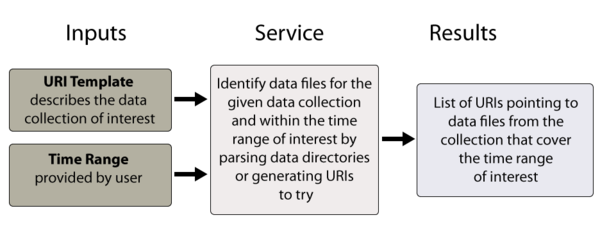
| 12:08, 29 March 2018 | generation_and_parsing.png (file) | Jbfaden | 33 KB | |
| 12:07, 29 March 2018 | template_use_overview.png (file) | Jbfaden | 62 KB | |
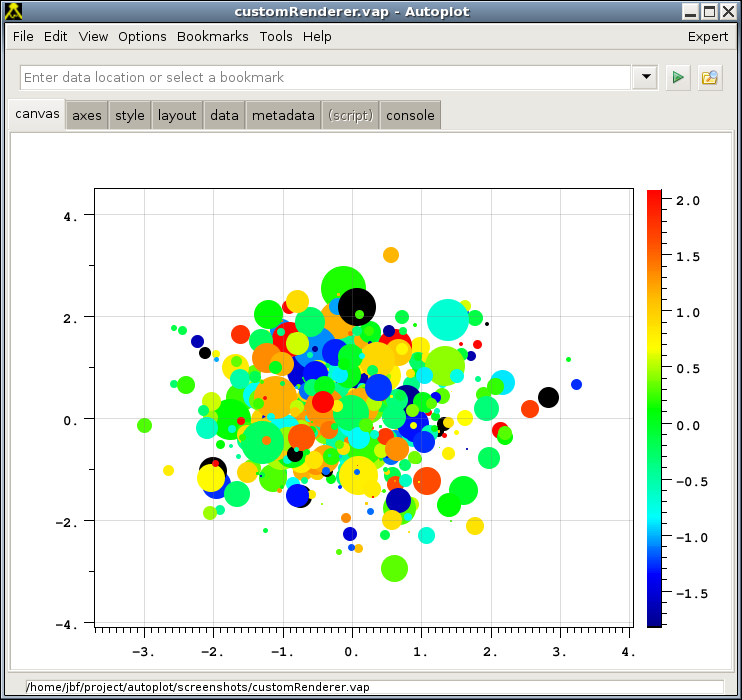
| 16:21, 30 November 2017 | customRenderer.png (file) | Jbfaden | 49 KB | (custom renderer) |
| 17:45, 23 November 2017 | Logo96.png (file) | Weigel | 3 KB | |
| 17:42, 23 November 2017 | Logo128.png (file) | Weigel | 4 KB | |
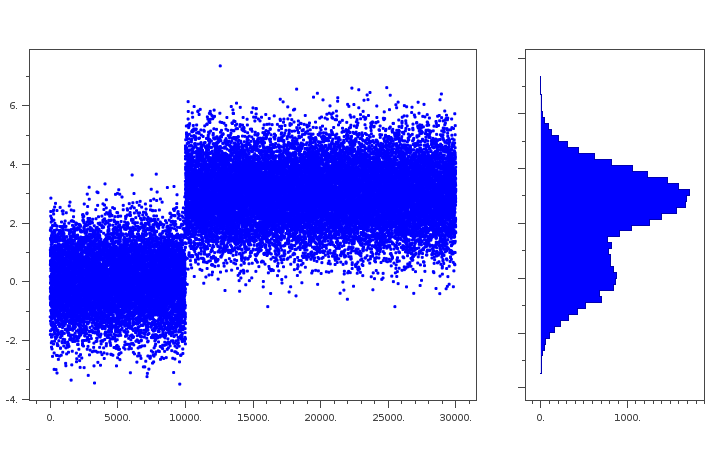
| 12:46, 16 November 2017 | CustomRendererVertHist.jpg (file) | Jbfaden | 45 KB | (Custom renderer draws a vertical histogram) |
| 19:22, 27 October 2017 | scripts_2.1_2.png (file) | Jbfaden | 41 KB | (special mode where z units are Units.rgbColor.) |
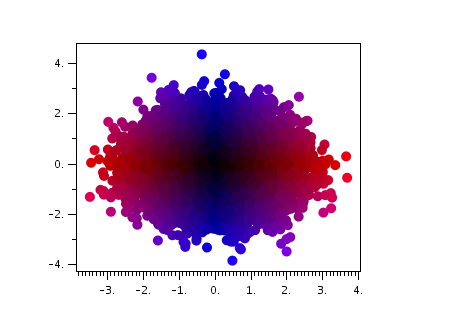
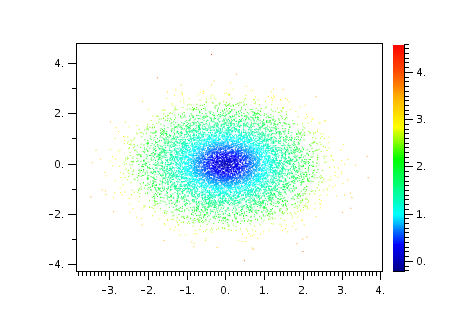
| 19:20, 27 October 2017 | scripts_2.1_1_1.png (file) | Jbfaden | 45 KB | (color scatter plot of random data where the color bar encodes the distance to the origin.) |
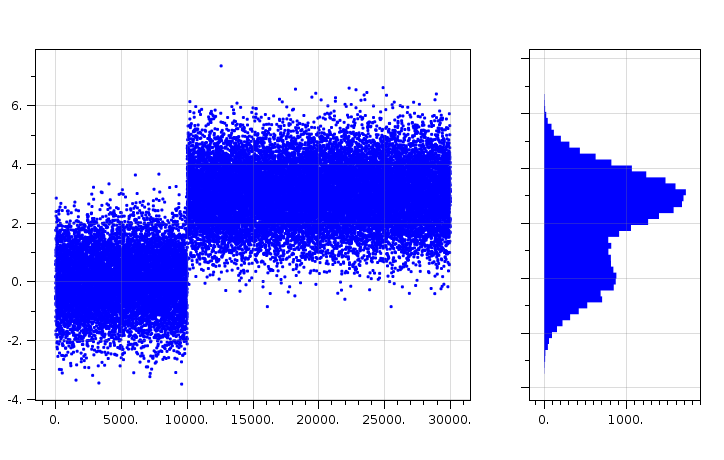
| 19:18, 27 October 2017 | scripts_2.1_1.png (file) | Jbfaden | 45 KB | |
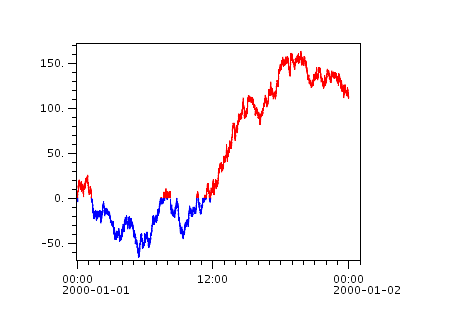
| 19:15, 27 October 2017 | scripts_2.1_0.png (file) | Jbfaden | 10 KB | (plot showing positive points as red, negative points as blue) |
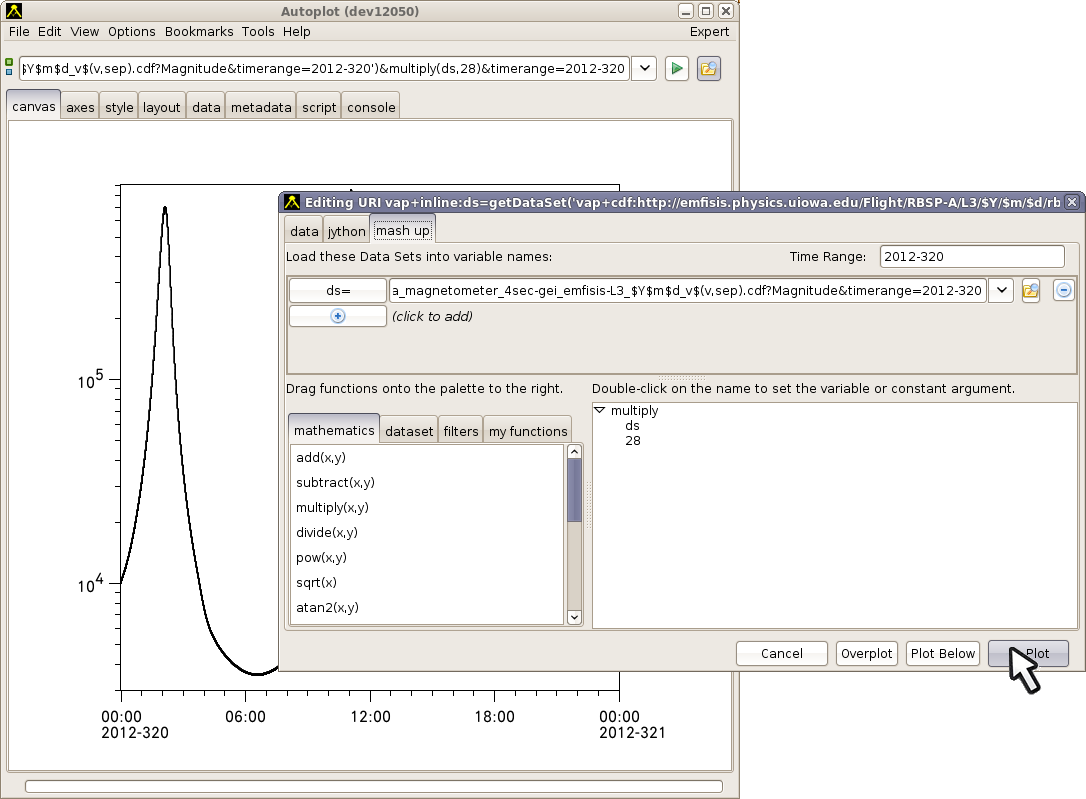
| 19:08, 21 October 2016 | Dashup0.jpg (file) | Jbfaden | 64 KB | (The Dashup Tool allows new data products to be created.) |
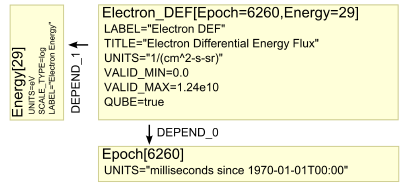
| 15:37, 15 February 2016 | qdataset-rank2.jpg (file) | Jbfaden | 31 KB | |
| 15:36, 15 February 2016 | qdataset-rank1-v2.jpg (file) | Jbfaden | 22 KB | |
| 15:32, 15 February 2016 | qdataset-rank1.jpg (file) | Jbfaden | 87 KB | |
| 15:18, 4 December 2015 | autoplotIntroduction.ppt (file) | Jbfaden | 2.03 MB | (Introductory PowerPoint (last updated AGU 2015).) |
| 12:40, 3 November 2015 | annotation2.png (file) | Jbfaden | 57 KB | (annotation example with annotation anchored to the NE corner of the plot.) |
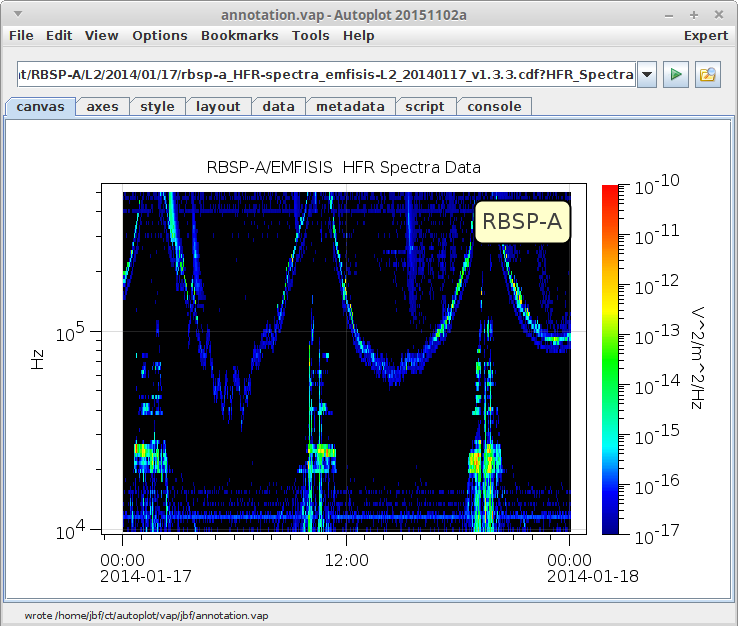
| 12:37, 3 November 2015 | annotation.png (file) | Jbfaden | 57 KB | (annotation example with annotation anchored to the NW corner of the plot.) |
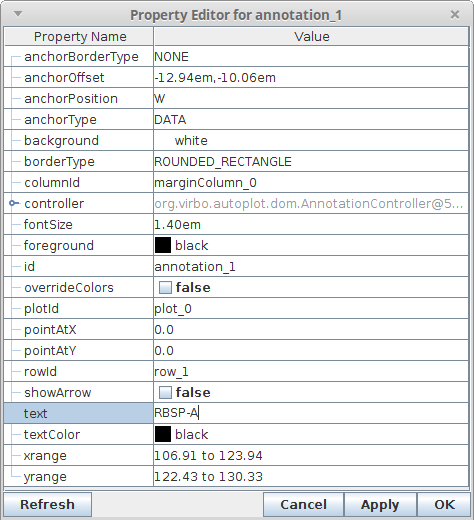
| 12:21, 3 November 2015 | annotationProperties.png (file) | Jbfaden | 28 KB | (properties dialog for annotations) |
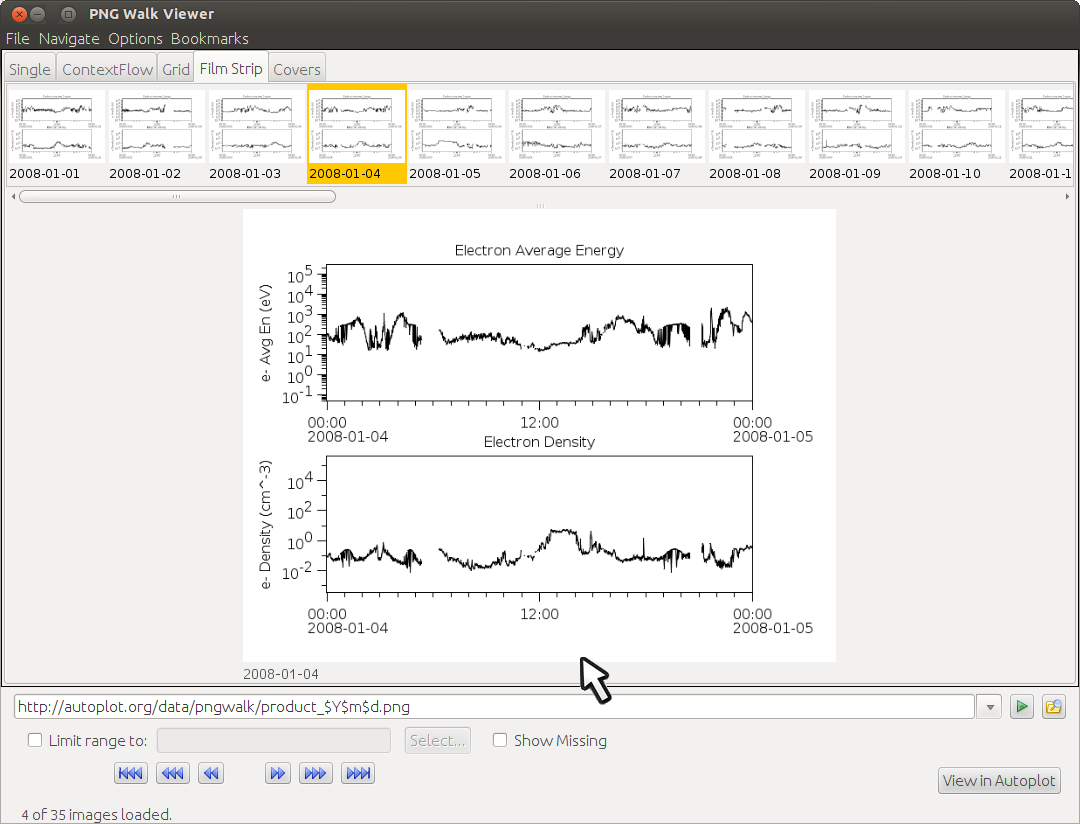
| 12:17, 16 October 2015 | pngwalk.png (file) | Jbfaden | 92 KB | |
| 14:24, 14 September 2015 | menubar.png (file) | Weigel | 10 KB | |
| 21:49, 12 September 2015 | tabs.png (file) | Weigel | 11 KB | |
| 20:42, 12 September 2015 | addressbar.png (file) | Weigel | 12 KB | |
| 13:00, 24 August 2015 | createPngWalk.jpg (file) | Jbfaden | 47 KB | (Create PNG Walk dialog) |
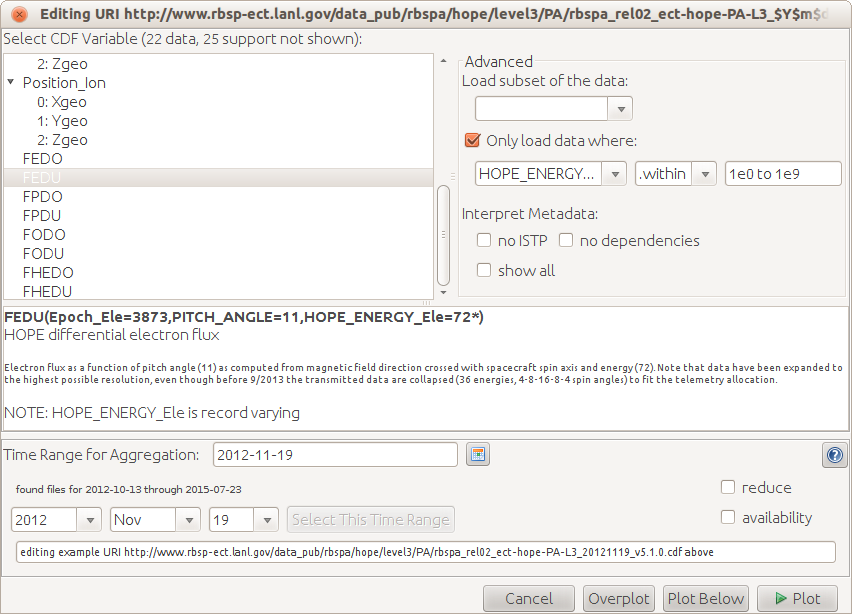
| 13:51, 29 July 2015 | cdfEditorPanel.jpg (file) | Jbfaden | 69 KB | (Screenshot of the CDF editor panel, showing the available parameters and descriptions of each.) |
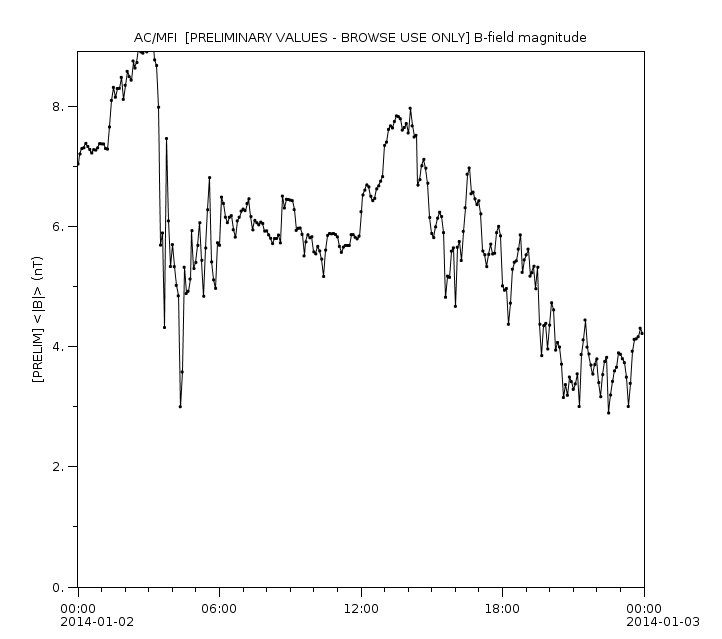
| 15:19, 1 November 2014 | product_20140102.png (file) | Jbfaden | 34 KB | (Image with metadata.) |
| 11:10, 31 January 2013 | Logo128x128b.png (file) | WikiSysop | 4 KB | |
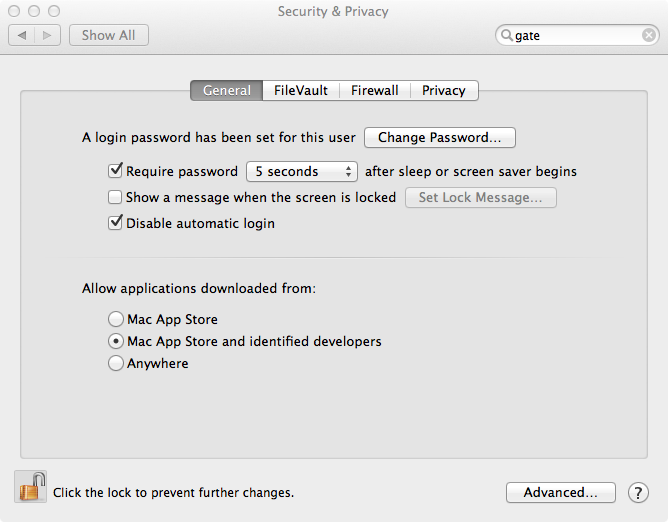
| 11:29, 28 October 2012 | MacLionSecurity.jpg (file) | Jbfaden | 68 KB | |
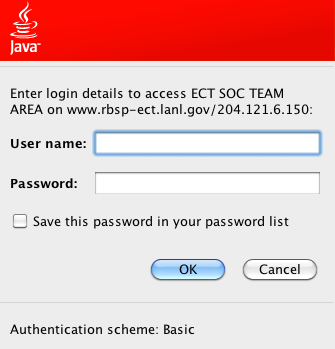
| 16:48, 26 October 2012 | javawsAuth.jpg (file) | Jbfaden | 23 KB | (Java Webstart plugs in an authentication module that gets in the way of the .keychain.txt file.) |
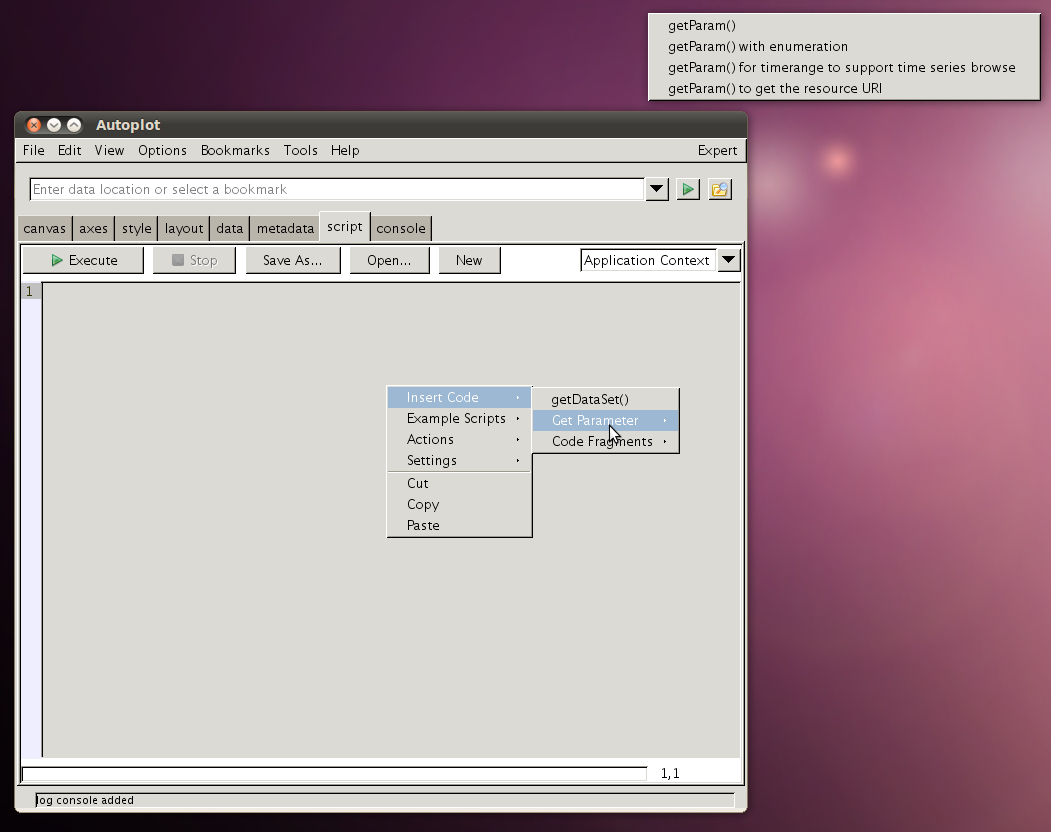
| 10:18, 30 August 2012 | java5gui.jpg (file) | Jbfaden | 176 KB | (Java 5 fails to correctly paint the popup menu.) |
| 14:11, 13 June 2012 | nnSpectrogram.png (file) | Jbfaden | 39 KB | |
| 12:25, 13 June 2012 | digital.png (file) | Jbfaden | 22 KB | |
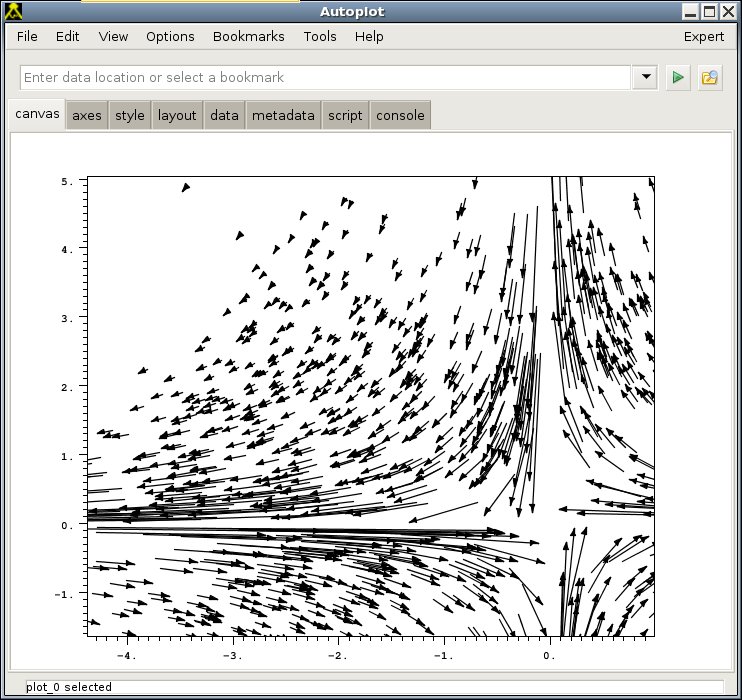
| 11:56, 13 June 2012 | custom2.png (file) | Jbfaden | 155 KB | (custom renderer shows flow) |
| 11:52, 13 June 2012 | custom1.png (file) | Jbfaden | 79 KB | (custom autoplot renderer, where data sets the size, color and location of each point.) |
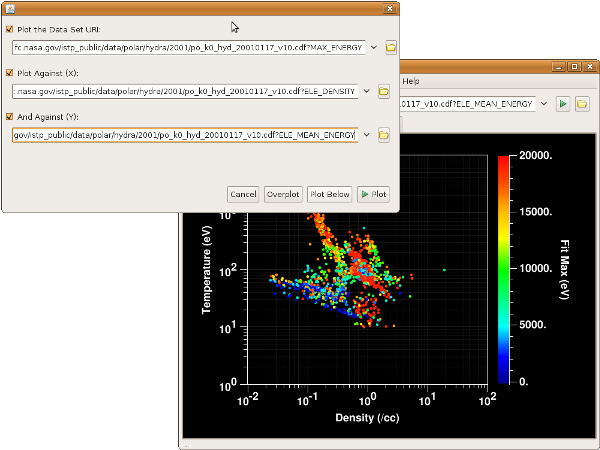
| 11:46, 13 June 2012 | colorScatter.png (file) | Jbfaden | 73 KB | |
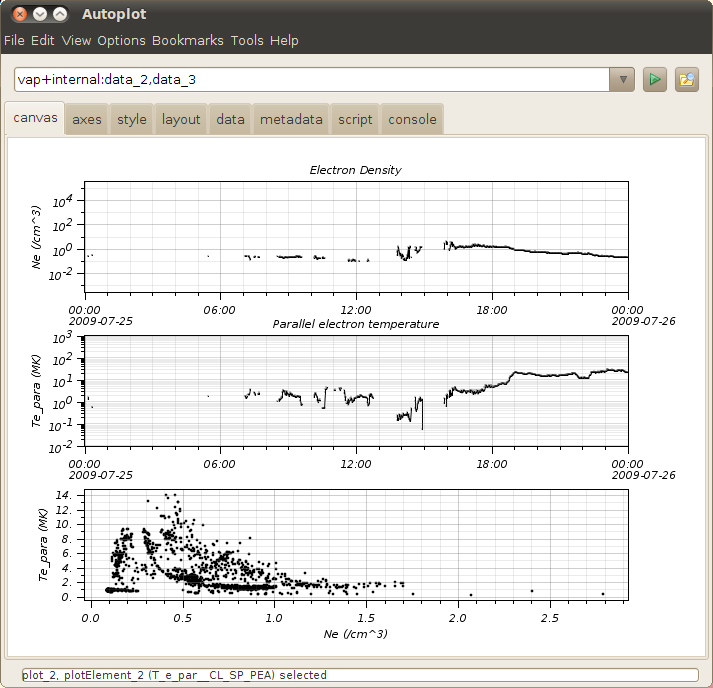
| 11:39, 13 June 2012 | scatter.png (file) | Jbfaden | 54 KB | (Bottom panel is a scatter plot.) |
| 11:36, 13 June 2012 | orbitPlot.png (file) | Jbfaden | 52 KB | |
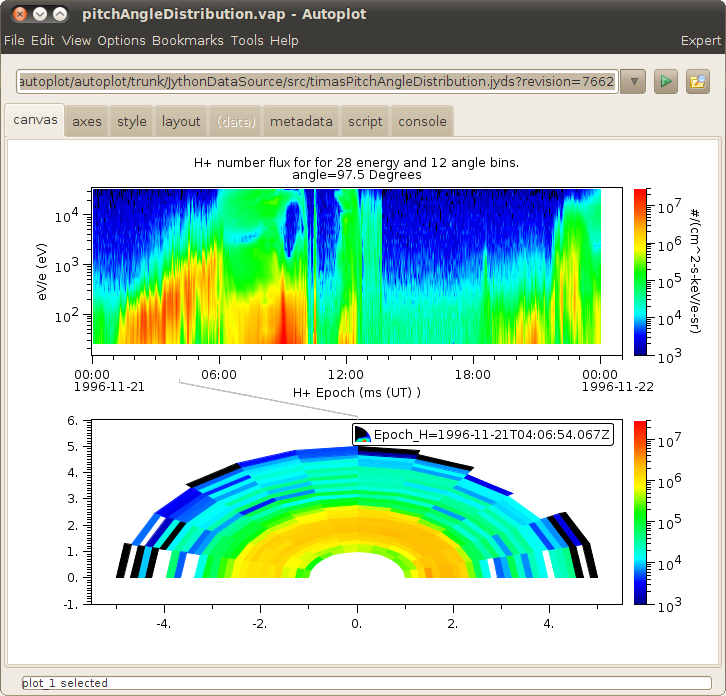
| 11:29, 13 June 2012 | pitchAngleDistribution.png (file) | Jbfaden | 157 KB | |
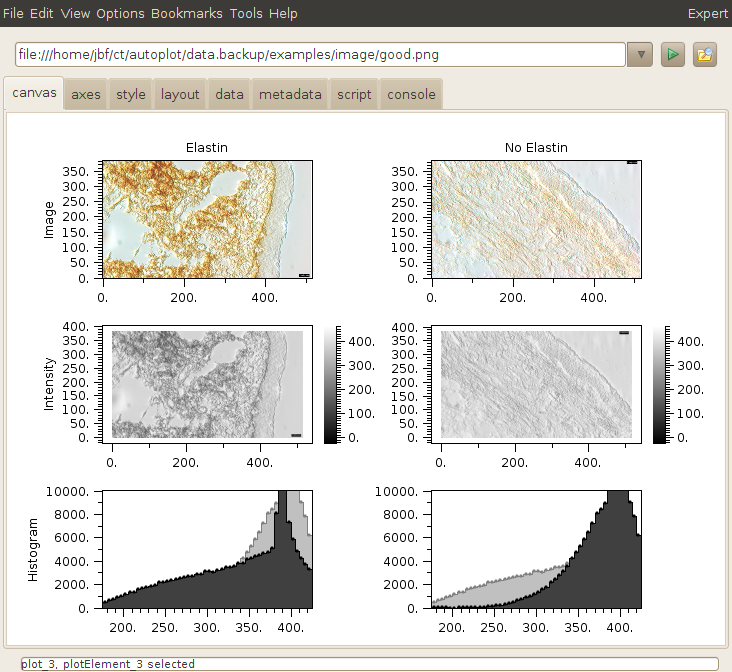
| 11:29, 13 June 2012 | imageRenderer.png (file) | Jbfaden | 212 KB | (Upper four plots use imageRenderer to look at image.) |
First page |
Previous page |
Next page |
Last page |
